
Last updated: September 2026 | Data checked against current insurance sources
Disclaimer: This article is for general informational purposes only and is not insurance, legal or financial advice.
Insurance rates, requirements and policy rules vary by state, insurer and individual circumstances and can change over time.
For advice about your own policy, consider speaking with a licensed insurance professional.
Ask five websites which state has the cheapest car insurance and you may get five different answers. New Hampshire, Vermont, Wyoming and North Dakota all appear at the top of some lists. The reason is not carelessness: each source measures something different, from real premiums paid by every insured driver to quotes for one carefully defined driver.
This guide starts with the most authoritative source available, the auto insurance database compiled by the National Association of Insurance Commissioners (NAIC), whose members are the state insurance regulators. We then compare it with two 2026 industry datasets, from Insurify and ValuePenguin, explain where they agree and disagree, and look at the reasons certain states cost less.
The Short Answer
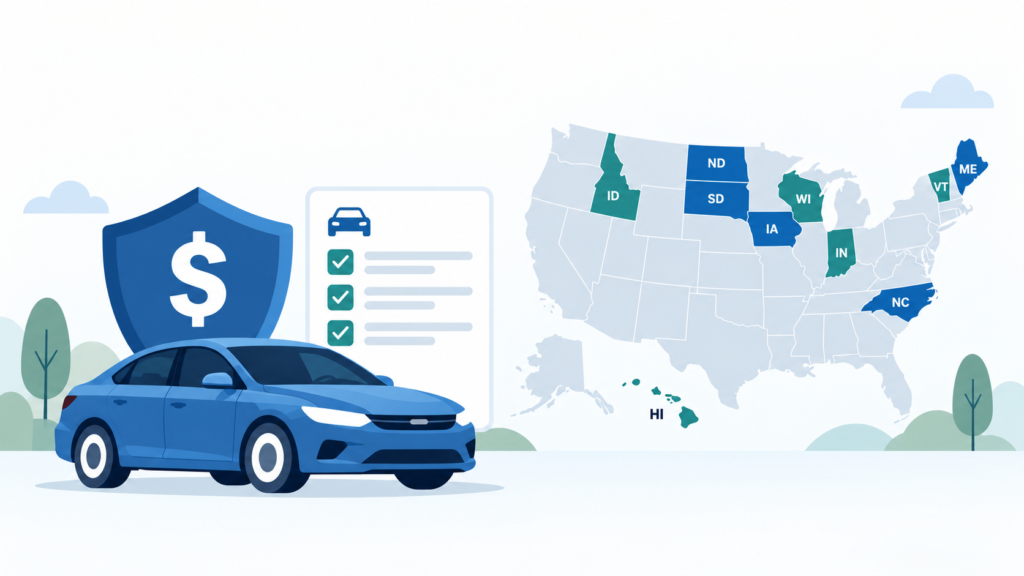
By the NAIC’s most recent published data (2023), the cheapest states for car insurance are North Dakota, Maine, Idaho, Iowa, Hawaii and Vermont. North Dakota’s average expenditure of $807.77 per insured vehicle is about 37% below the national average of $1,281.60, and Florida, the most expensive state in the same data, averages $1,863.82, or 2.3 times as much.
Four states appear among the ten cheapest in all three datasets we compared (the NAIC, Insurify and ValuePenguin): Hawaii, Idaho, North Carolina and Wisconsin. Widening the comparison to the fifteen cheapest in each dataset adds Indiana, Iowa, Ohio and Wyoming. New Hampshire is the cheapest state in Insurify’s 2026 data and fourth cheapest in ValuePenguin’s, but it ranks only 16th in the NAIC’s 2023 data. We explain why below.
Key Takeaways
- The NAIC’s data measure what drivers actually paid, so it is the best starting point, but the latest edition covers 2023, and prices have risen since.
- The NAIC itself warns that direct comparisons between states should be treated with a high degree of caution because the figures do not control for driver profile, limits or deductibles.
- The rankings are broadly consistent at the extremes: the Upper Midwest and Plains states, northern New England, Idaho and Hawaii tend to be cheap, while Florida, New York, Louisiana and Washington, D.C. are the most expensive in the NAIC data.
- Cheap in dollars is not always affordable in relation to income, and the cheapest state on average is not necessarily the cheapest for you.
How We Ranked the States
The official source. The NAIC’s 2023 Auto Insurance Database Average Premium Supplement (published June 2025) reports written premiums and exposures for every state, compiled from statistical agents and state departments of insurance. It gives three state-level measures:
- Average expenditure: total written premiums for liability, collision and comprehensive coverage divided by liability car-years. It assumes every insured vehicle carries liability coverage but not necessarily collision or comprehensive.
- Combined average premium: the sum of the average liability, collision and comprehensive premiums, which represents a policy with all three coverages.
- Liability average premium: the average liability premium per insured vehicle. In the NAIC’s technical notes this includes coverages such as uninsured and underinsured motorist, medical payments and no-fault or personal injury protection.
The NAIC states that it does not distinguish policyholder classifications, vehicle characteristics or the limits and deductibles selected, and it does not consider differences in state auto and tort laws, rate filing laws or traffic conditions. That is why it cautions that direct comparisons between states should be made carefully.
Cross-checks. We compared the NAIC ranking with Insurify’s state table (through August 2026, published September 8, 2026) and ValuePenguin’s state table (updated July 14, 2026). Both price a specific type of driver, so they are useful for current levels but not a replacement for the regulator’s data. We used the NAIC’s own supplement rather than secondary copies of its tables, because we found that at least one website reproduced an older year’s ranking under a 2023 label.
The Ten Cheapest States, According to the NAIC (2023)
| Rank | State | Average expenditure | Compared with the national average | Combined average premium (rank) | Liability average premium (rank) |
| 1 | North Dakota | $807.77 | 37% below | $961.28 (3) | $331 (1) |
| 2 | Maine | $856.28 | 33% below | $926.02 (1) | $425 (6) |
| 3 | Idaho | $863.96 | 33% below | $981.07 (4) | $482 (11) |
| 4 | Iowa | $869.46 | 32% below | $1,009.57 (7) | $387 (4) |
| 5 | Hawaii | $888.07 | 31% below | $998.04 (5) | $464 (9) |
| 6 | Vermont | $893.16 | 30% below | $957.80 (2) | $381 (3) |
| 7 | Wisconsin | $921.55 | 28% below | $1,000.32 (6) | $447 (7) |
| 8 | North Carolina | $925.08 | 28% below | $1,096.56 (11) | $448 (8) |
| 9 | Indiana | $926.42 | 28% below | $1,031.86 (8) | $485 (15) |
| 10 | South Dakota | $936.15 | 27% below | $1,157.54 (12) | $378 (2) |
| National | $1,281.60 | $1,438.46 | $737 |
Ranks are from cheapest (1) to most expensive (51, counting the District of Columbia). Source: NAIC, 2023 Auto Insurance Database Average Premium Supplement, Tables 1C, 4 and 5.
The NAIC’s median state average expenditure was $1,114, so the ten cheapest states are all well below the middle of the pack. Prices moved up everywhere in 2023: the national average expenditure rose 14.0% from 2022, and among the ten cheapest states the increase ranged from 5.2% in Hawaii to 13.8% in Indiana.
How Three Datasets Compare
| State | NAIC 2023 average expenditure per year (rank) | Insurify, full coverage per month, 2026 (rank) | ValuePenguin, full coverage per month, 2026 (rank) |
| North Dakota | $807.77 (1) | $114 (7) | $180 (16) |
| Maine | $856.28 (2) | $139 (16, tied) | $129 (2) |
| Idaho | $863.96 (3) | $107 (4) | $148 (6, tied) |
| Iowa | $869.46 (4) | $111 (5) | $170 (12, tied) |
| Hawaii | $888.07 (5) | $126 (9, tied) | $151 (8) |
| Vermont | $893.16 (6) | $143 (19) | $128 (1) |
| Wisconsin | $921.55 (7) | $126 (9, tied) | $168 (10) |
| North Carolina | $925.08 (8) | $113 (6) | $147 (5) |
| Indiana | $926.42 (9) | $129 (11) | $166 (9) |
| South Dakota | $936.15 (10) | $152 (22) | $196 (23) |
| Ohio | $947.24 (11) | $117 (8) | $148 (6, tied) |
| Wyoming | $948.24 (12) | $94 (2) | $131 (3) |
| New Hampshire | $986.84 (16) | $84 (1) | $134 (4) |
| Alaska | $1,112.96 (25) | $98 (3) | $170 (12, tied) |
Ranks run from cheapest (1) to most expensive (51); “tied” means another state has the same figure. Insurify and ValuePenguin figures are monthly averages for full coverage. Sources: NAIC 2023 Auto Insurance Database Average Premium Supplement; Insurify (September 8, 2026); ValuePenguin (July 14, 2026).
The Five Cheapest by Each Measure
| Rank | NAIC average expenditure (2023, per year) | NAIC liability premium (2023, per year) | NAIC combined premium (2023, per year) | Insurify full coverage (2026, per month) | Insurify liability-only (2026, per month) | ValuePenguin full coverage (2026, per month) |
| 1 | North Dakota, $808 | North Dakota, $331 | Maine, $926 | New Hampshire, $84 | Wyoming, $50 | Vermont, $128 |
| 2 | Maine, $856 | South Dakota, $378 | Vermont, $958 | Wyoming, $94 | New Hampshire, $52 | Maine, $129 |
| 3 | Idaho, $864 | Vermont, $381 | North Dakota, $961 | Alaska, $98 | Iowa, $56 | Wyoming, $131 |
| 4 | Iowa, $869 | Iowa, $387 | Idaho, $981 | Idaho, $107 | Wisconsin, $57 | New Hampshire, $134 |
| 5 | Hawaii, $888 | Wyoming, $390 | Hawaii, $998 | Iowa, $111 | Vermont, $58 | North Carolina, $147 |
Why the Rankings Do Not Match Exactly
The differences are informative rather than contradictory.
They measure different drivers. The NAIC counts every insured vehicle, including drivers with tickets, accidents or poor credit and business written through residual markets. Insurify prices drivers aged 20 to 70 with clean records and average or better credit, and ValuePenguin prices a 30-year-old man with good credit and a clean record. A state with many high-risk insured drivers looks more expensive in the NAIC data than in quote-based data.
They measure different coverage. The NAIC’s average expenditure assumes liability coverage on every vehicle but not necessarily collision or comprehensive. Insurify’s full-coverage figures assume comprehensive and collision with $1,000 deductibles, while ValuePenguin reports a full-coverage policy without listing the deductibles in its state table.
They measure different years. The NAIC’s latest edition covers 2023, while the commercial datasets reflect 2026 prices. Since then, the Bureau of Labor Statistics’ consumer price index for motor vehicle insurance, as reproduced by Triple-I, rose 6.0% in 2025 after increases of 17.4% in 2023 and 17.8% in 2024.
They use different statistics. Insurify uses two-year rolling medians for most states and one-year medians for Maine, Massachusetts, Michigan, Montana, North Dakota, Nebraska, New Hampshire, New Jersey and Vermont. The NAIC uses aggregate premiums divided by aggregate exposures, an average across all vehicles.
Where the Sources Disagree Most
- New Hampshire: first in Insurify ($84 a month) and fourth in ValuePenguin ($134), but 16th in the NAIC’s average expenditure ($986.84) and 9th in its combined premium. New Hampshire is also the only state without a general auto insurance mandate (see below), which may mean the pool of insured drivers differs from other states. The NAIC’s data do not explain this, so treat that as a hypothesis, not a finding.
- Alaska: third cheapest in Insurify ($98 a month) but 25th in the NAIC’s data ($1,112.96), almost exactly at the national median.
- North Dakota and South Dakota: the NAIC ranks them first and tenth by average expenditure and first and second by liability premium. Insurify ranks them 7th and 22nd, and ValuePenguin ranks them 16th and 23rd.
- Vermont: first in ValuePenguin ($128 a month) and second in the NAIC’s combined premium, but 19th in Insurify ($143).
When three reputable sources disagree, the honest conclusion is that the states in the middle of the cheap group are close together and their order depends on the method. The states that appear in all three lists (Hawaii, Idaho, North Carolina and Wisconsin) are the most reliable answers.
Why These States Are Cheaper
The NAIC lists many factors behind state-to-state differences: underwriting and loss adjustment expenses, the coverages purchased, weather, driving locations, accident rates, traffic density, vehicle theft rates, auto repair costs, population density, medical and legal costs, per capita disposable income, rate and form filing laws, liability insurance requirements and state auto laws. The NAIC says insurance rates are developed mainly from the insurer’s cost of paying claims.
According to a summary of the NAIC’s work by Triple-I, three variables are correlated with state premiums: urban population, miles driven per highway mile (a measure of traffic intensity) and disposable income per capita. High-premium states tend to be highly urban, with higher wage and price levels and greater traffic density.
Rural roads fit that pattern. The Insurance Institute for Highway Safety (IIHS) reports that in 2024 the states with the highest share of crash deaths on rural roads were North Dakota (81%), Maine (80%), South Dakota (80%) and Montana (79%). Three of those four, North Dakota, Maine and South Dakota, are among the NAIC’s ten cheapest states. This is a correlation, not proof of cause, and Hawaii, where only 13% of crash deaths were on rural roads, is a clear exception. The NAIC’s data do not isolate what keeps Hawaii’s average low.
New Hampshire: The Legal Exception
New Hampshire is the only state that does not require all drivers to buy auto insurance, according to a 2013 report by the Connecticut General Assembly’s Office of Legislative Research and to Insurify’s 2026 data. The state’s law (RSA 264) instead requires drivers to prove financial responsibility after certain events:
- RSA 264:3 says that after an accident report, the director of the Division of Motor Vehicles must suspend the license and registration of the driver and owner until they furnish security to satisfy any judgments and give proof of financial responsibility for the future, unless a liability policy was in effect at the time of the accident.
- RSA 264:20 defines proof of financial responsibility as the ability to pay damages of $25,000 for bodily injury to one person, $50,000 for injury to two or more people in one accident and $25,000 for property damage.
- RSA 264:22 allows a person to give that proof by depositing money or approved securities with the state treasurer, as an alternative to a policy.
Most New Hampshire drivers still buy insurance voluntarily, and the state’s DMV can require insurance after a conviction or an accident. This rule changes how insurance works in the state, but the sources we reviewed do not measure how much it affects prices.
Ohio’s Note
The NAIC notes that Ohio’s financial responsibility requirement can be satisfied by means other than insurance. Ohio appears among the ten cheapest states in both Insurify and ValuePenguin and 11th in the NAIC’s average expenditure.
Cheap Is Not the Same as Affordable
The Insurance Research Council (IRC) compared the NAIC’s average expenditures with median household income from the Census Bureau. For 2021, as reproduced by Triple-I, auto insurance took the smallest share of income in Idaho and New Hampshire (0.96% each), followed by Hawaii, Iowa, Maine and North Dakota (1.00% each). The U.S. average was 1.50% and the highest share was Louisiana at 2.62%.
ValuePenguin’s 2026 analysis, which uses average full-coverage premiums, reports the same order at the low end: New Hampshire (1.5% of monthly household income), Hawaii (1.7%), Vermont (1.8%) and Maine (1.9%). Its national figure is 2.9%, roughly double the IRC’s, because it measures full coverage instead of the NAIC’s average expenditure.
The Cheapest State for Your Situation
The cheapest state on average can still be an expensive place for your own profile. Consider these points:
- A state average is a benchmark. The NAIC, Insurify and ValuePenguin all note that prices vary by driver, vehicle, limits and neighborhood.
- Compare quotes in your state. ValuePenguin’s state table shows wide gaps between insurers, so shopping around may save more than moving would.
- Check your state insurance department. Regulators publish consumer guides and complaint data, and you can find your department through the NAIC.
- Do not choose a state only for the price of insurance. Housing, taxes and income usually matter far more.
Frequently Asked Questions
What is the cheapest state for car insurance in 2026?
It depends on the source. The NAIC’s most recent regulator data (2023) ranks North Dakota cheapest. Insurify’s 2026 data ranks New Hampshire cheapest, and ValuePenguin’s 2026 data ranks Vermont cheapest. Hawaii, Idaho, North Carolina and Wisconsin appear among the ten cheapest states in all three.
Why is car insurance cheap in North Dakota, Maine and Idaho?
The NAIC links state premiums to factors such as urban population, traffic intensity, accident rates, repair and medical costs and income. North Dakota, Maine and Idaho are largely rural states with lower average premiums. The data do not prove that rural roads alone explain the difference.
Is car insurance optional in New Hampshire?
Not exactly. New Hampshire does not mandate insurance for all drivers, but state law requires drivers to prove financial responsibility after certain events, such as an at-fault accident or certain convictions, through insurance or a deposit with the state treasurer.
Why does the NAIC ranking differ from the 2026 rankings?
The NAIC reports 2023 averages across all insured vehicles, while Insurify and ValuePenguin report 2026 prices for defined driver profiles. Prices have also risen since 2023.
Will the cheapest states stay cheap?
Not necessarily. Prices rose in every state in 2023, and Insurify projects increases of about 2% in Wyoming by the end of 2026, among other states.
Related guides: Average Cost of Car Insurance in 2026: Why Every Site Shows a Different Number; Average Car Insurance Cost by State (2026 Data Compared); Most Expensive States for Car Insurance in 2026; Minimum Car Insurance Requirements by State.
SOURCES
Official and regulatory: National Association of Insurance Commissioners (NAIC), 2023 Auto Insurance Database Average Premium Supplement (June 2025), Tables 1C, 4 and 5, and its news release on the 2022/2023 Auto Insurance Database Report (February 2026); New Hampshire Revised Statutes Annotated, RSA 264:3, 264:20 and 264:22 (gc.nh.gov); Connecticut General Assembly, Office of Legislative Research, “Motor Vehicle Financial Responsibility in New Hampshire” (2013); U.S. Department of Labor, Bureau of Labor Statistics, Consumer Price Index (as reproduced by Triple-I).
Insurance industry organizations: Insurance Information Institute (Triple-I), Facts + Statistics: Auto insurance, including its reproduction of the Insurance Research Council’s affordability study; Insurance Institute for Highway Safety, Fatality Facts 2024: State by state.
Commercial insurance sites (used to cross-check): Insurify, “Average Car Insurance Rates as of September 2026” (September 8, 2026); ValuePenguin (LendingTree), “Compare 2026 Car Insurance Rates” (July 14, 2026).